Your cool roof keeps the electric grid running on hot days.
Hot summer days are vulnerable days for the electric grid, which is strained by excess demand that can lead to brownouts and blackouts. These service interruptions can cost businesses and organizations millions in ruined productivity.
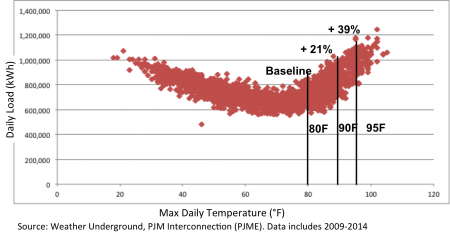
As temperatures rise above the upper 75-80°F (24-27°C), demand for cooling energy rises rapidly. The following graphs compare maximum daily temperatures to total electricity demand in Washington DC between 2009 and 2014. As you can see demand spikes rapidly as temperatures rise with a 21% increase in total electricity demand when the maximum temperature is 90°F (32°C) versus 80°F (27°C) and a 39% increase when the maximum temperature is 95°F (35°C). This graph is similar on nearly every city with high penetration of air conditioning.

While grid operators can plan for these spikes, rapidly changing urban heat conditions will limit the usefulness modeling the future on historic weather patterns. Dr. Ray Klump highlights the unique challenge of heat on the electric grid in his article Why Does Hot Weather Cause Power Outage. He notes that electric transmission lines, essentially just metal coils in dark insulation, can carry less electricity the hotter it gets and start to droop. This makes them vulnerable to getting snared in trees and other foliage. He summarizes, “In other words, there are some rather nasty feedback mechanisms that take place that cause the grid a lot of stress when we all turn our air conditioners on. Power system operators traditionally have had a very limited number of controls to counteract these bad behaviors.”
Cool roofs directly help reduce excess urban heat, which causes up to 10% of U.S. peak electricity demand for air conditioning. Even a small change in temperature on a warm day can make a very big difference in energy demand.
In climate zones where summer brings peak electricity demand from air conditioning, cool roofs are of great value to utilities and grid operators. They can improve utility capacity utilization and therefore profitability, reduce transmission line congestion, avoid congestion pricing, and forego the need for additional investments in peaking generation capacity. Approximately 5% to 10% of U.S. peak electricity demand for air conditioning is a result of the urban heat island effect. Research indicates that peak electricity demand increases by 2% to 4% for every 1.8°F (0.5 °C) increase in temperature above a threshold of about 70°F (20°C). Rosenfeld et al. (1996) estimated that eliminating the urban heat island effect in Los Angeles—a reduction of 3 degrees Celsius (5.4°F)—could reduce peak power demand by 1.6 gigawatts resulting in a savings of about $175 million per year (at 1996 electricity prices). A 2004 analysis of New York City when electricity averaged 16.5 cents per kWh found that a one degree reduction in temperature would cut energy costs by $82 million per year. Electricity prices have subsequently increased by over 20%.
Many businesses pay a “demand charge” based on their maximum monthly electricity use, often due to high demand cooling energy. These fees can be add up to more than half the electric bill. Cool roofs have been shown to significantly cut these hidden energy costs for business.
Many businesses pay a “demand charge” based on their maximum monthly electricity use, often due to high demand cooling energy. These fees can be add up to more than half the electric bill. Cool roofs have been shown to significantly cut these hidden energy costs for business.
James Hoff’s describes how we pay for electricity in his 2014 paper Reducing Peak Energy Demand: A Hidden Benefit of Cool Roofs.
“(M)onthly electricity costs are composed of two distinctly different types of charges. The first is base energy use, which measures the total quantity of electricity supplied for the billing period. The second is peak energy demand, which measures the highest amount of power supplied at any one time within the billing period. Base energy use is measured in kilowatt-hours (kWh), while peak energy demand is measured in kilowatts (kW). One way to help understand the relationship between base energy use and peak demand load is to use the analogy of an odometer and speedometer in a car. The base amount of energy used (kWh) can be compared to miles driven as shown on the odometer, while peak energy demand (Kw) would be similar to the top speed driven.”
Most cool roof and efficiency calculators focus on base energy demand but misses the peak demand charge piece. This can exclude over 50% of the savings for some businesses. Hoff also finds that peak energy demand is basically the same across climate zones while base energy demand declines in colder climate zones, as shown in his graph below.

The implication is that peak demand savings become a bigger part of the economic justification in colder climates, but may not be getting counted in the analysis with the current valuation tools.
Cooler roof surfaces help solar panels make more energy from the same amount of sunlight by keeping them cooler than solar panels on a dark roof.
Solar PV need the sun, but do not respond well when hot. One paper finds that the efficiency of a solar PV cell decreases by 0.5% for every 1.8 °F (1 °C) rise in temperature above 77 °F (25 °C). On a hot summer day, the efficiency of a solar cell could drop as much as 25% or more. This effect is, in part, due to the fact that the wires that carry the electricity generated by the solar panels experience greater resistance when hot. There are a number of anecdotal examples of increased solar output after cool roofs are installed. Several of those examples are detailed in this article.